
Chapter 1, Part II - Shape of The Earth - Isolines - Test Review
Instructions: Click on the button to see if your answer is correct or not. I recommend keeping track of how many you get correct on your first try. You might need your reference tables for this... look in the back of your book, starting on page 245.
Use the contour map below to answer questions 1 through 14. Points A, B, C, D, and E represent specific locations on the map shown by the closest dot. Location F represents the value of the contour line that it is on, where a contour value was supposed to be if you follow the normal rules, but was omitted for use as a question below.
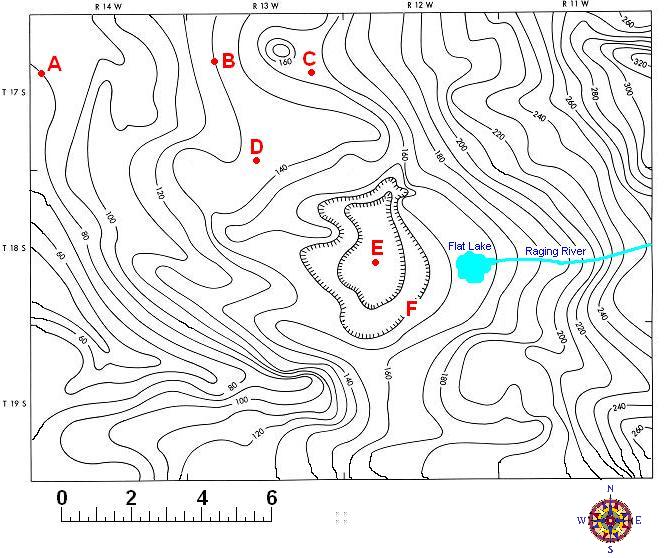
What is the contour interval of this map?
20 meters
10 meters
33 meters
66 meters
What is the elevation of location A?
79 meters
80 meters
81 meters
70 meters
What is the elevation of location B?
110 meters
120 meters
130 meters
140 meters
What is the lowest possible elevation of location D?
130 meters
131 meters
135 meters
140 meters
What is the highest possible elevation of location D?
130 meters
139 meters
140 meters
141 meters
What is a possible elevation of location C?
150 meters
160 meters
156 meters
166 meters
What is the elevation of the contour line represented by the letter F?
120 meters
130 meters
140 meters
150 meters
What is the highest possible elevation of location E, if the value of contour line F was 140 meters?
130 meters
131 meters
120 meters
129 meters
What is the lowest possible elevation of location E, if the value of contour line F was 140 meters?
120 meters
121 meters
119 meters
131 meters
What is the distance between location A and location B?
10 km
11 km
6 km
12 km
What is the gradient between location A and location B?
10.0 m/km
0.1 m/km
50.0 m/km
5.0 m/km
What is a possible elevation of the top of Flat Lake?
150 meters
160 meters
153 meters
163 meters
Which way is Raging River flowing?
towards the North.
towards the South.
towards the East.
towards the West.
What is the field value on this map?
height
elevation
temperature
barometric pressure

Base your answers to questions 15 through 20 on the topographic map below. Points A, B, C, D, E, F, X, and Y are locations on the map. Elevation is measured in feet.
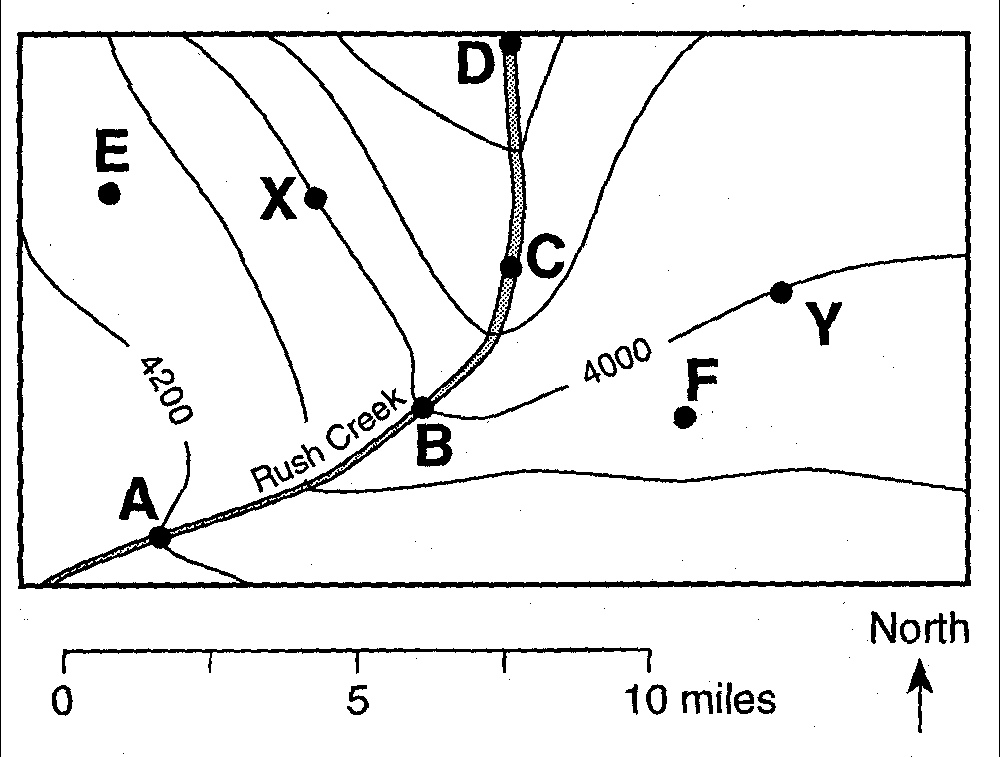
What is the contour interval for this map?
200 ft
100 ft
50 ft
20 ft
Which locations have the greatest difference in elevation?
A and D
B and X
E and Y
C and F
Between points C and D, Rush Creek flows toward the
north
south
east
west
The gradient between points A and B is closest to
20 ft/mi
40 ft/mi
80 ft/mi
200 ft/mi
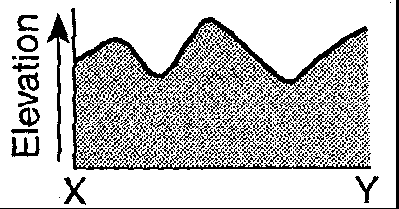
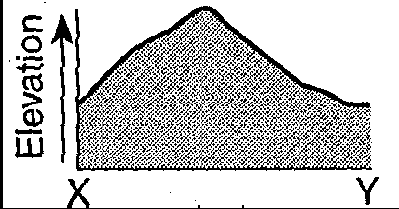
Which diagram best represents the profile along a straight line between points X and Y?

What is the approximate length of the portion of Rush Creek shown on this map?
10 mi
15 mi
20 mi
100 mi
A stream in New York State begins at a location 350 meters above sea level
and flows into a swamp 225 meters above sea level. The length of the stream
is 50 kilometers. What is the gradient of the stream?
4.5 m/km
7 m/km
2.5 m/km
40 m/km
Which equation can be used to correctly calculate the air-pressure gradient between two locations?


What is the field value for isobars?
elevation
precipitation
temperature
atmospheric pressure
In the diagram below, the thermometer held 2 meters above the floor shows a temperature of 40�C. The thermometer on the floor shows a temperature of 24�C.

What is the temperature gradient between the two thermometers?
13 �C/m
20 �C/m
12 �C/m
8 �C/m
Use the contour map below to answer questions 25 through 29. The letters A, B, C, D, and E represent locations on the map.

What is the highest possible elevation on this map?
60 meters
61 meters
70 meters
79 meters
What is the contour interval on this map?
10 meters
20 meters
40 meters
60 meters
What is the elevation at location A?
20 meters
10 meters
0 meters
-20 meters
Which location is at sea level?
A
B
C
D
Which two locations have the same elevation?
A and B
A and E
B and D
C and D
Which of the following is the most correct statement referring to a river?
Upstream means up hill, downstream means down hill, and a river flows from downstream to upstream.
Downstream means up hill, upstream means down hill, and a river flows from downstream to upstream.
Upstream means up hill, downstream means down hill, and a river flows from upstream to downstream.
Downstream means up hill, upstream means down hill, and a river flows from upstream to downstream.
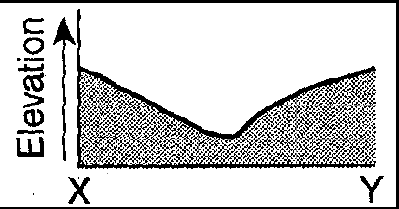
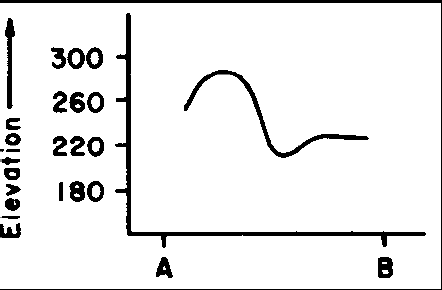
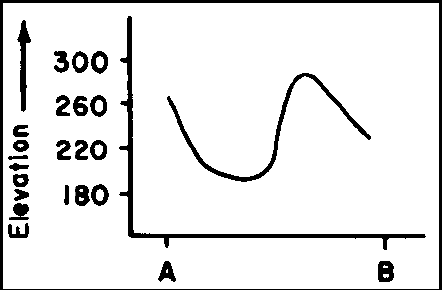
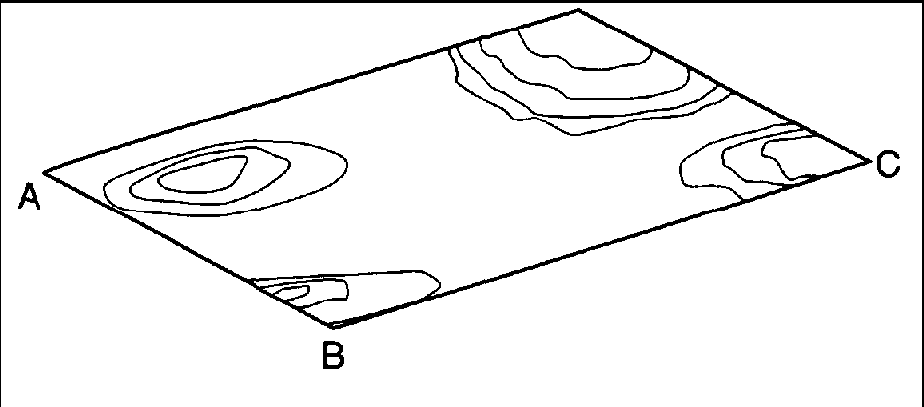
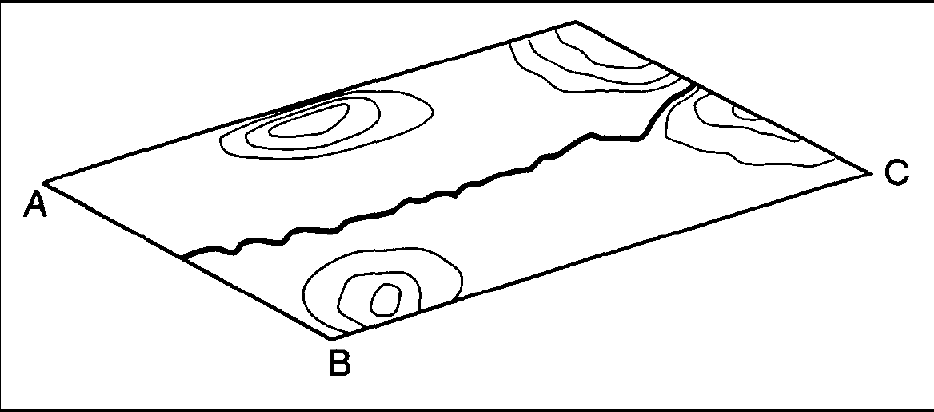
Base your answers to questions 31 through 35 on your knowledge of earth science and on the diagram below which represents the elevation data for a certain landscape region. Points A, B, C, and D are specific locations on the surface of this landscape.
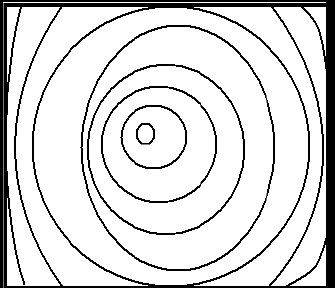
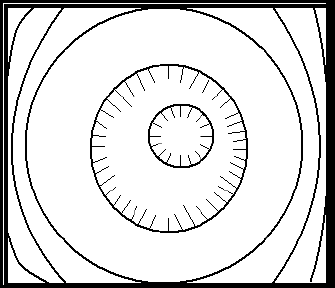
If the symbol in the diagrams below indicates the possible location of a lake, which diagram best represents where a lake would most likely be located on this landscape?
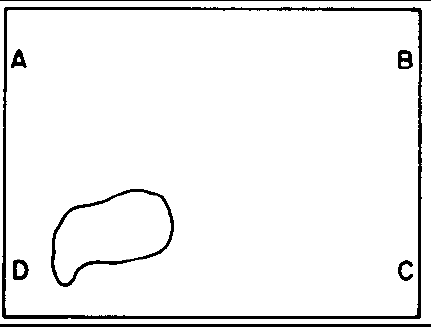


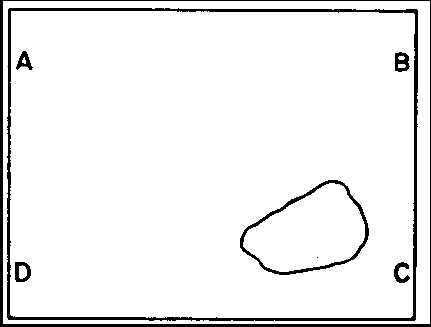
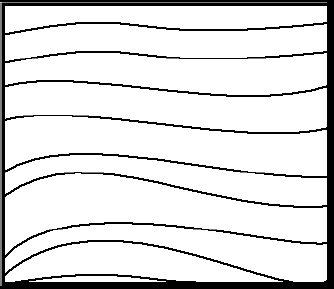
Which diagram best represents the location of the isolines for the elevation field of this landscape?
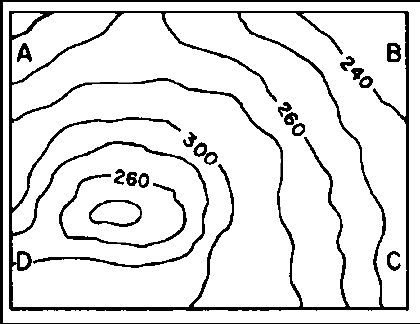
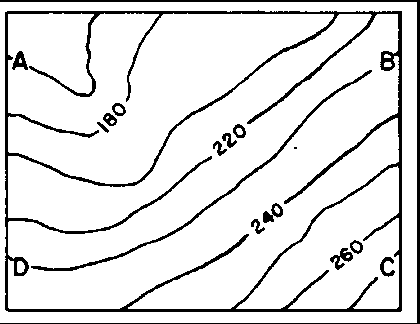
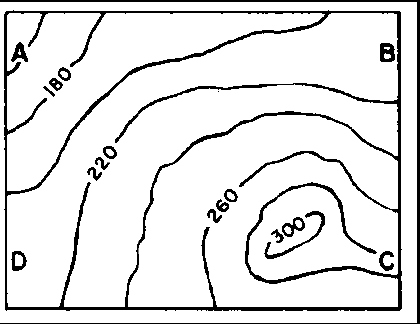
Determine the location of the highest landscape feature in the elevation field. This landscape feature is found in which region of the elevation field?
southwest
southeast
northwest
northeast
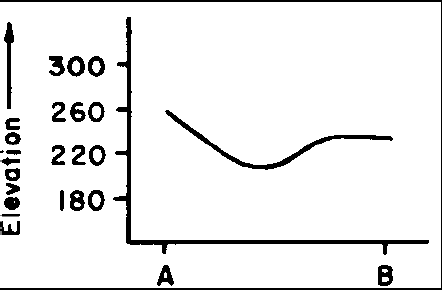
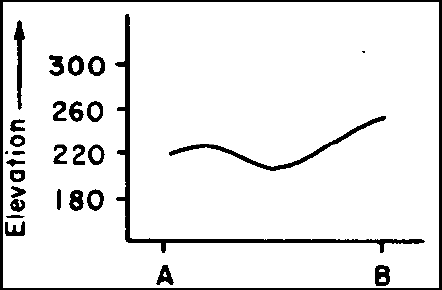
Which graph best represents the elevation profile along a straight line from point A to point B?
The steepest slopes in this landscape are located along a straight line between points
A and C
B and C
B and D
D and C
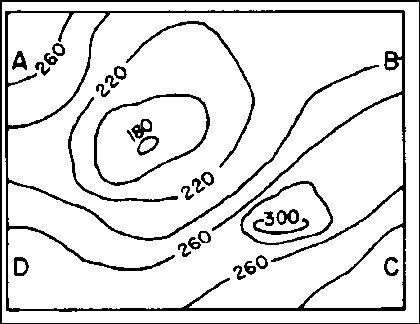
The diagram below is a three-dimensional model of a landscape region.

Which map view best represents the topography of this region?
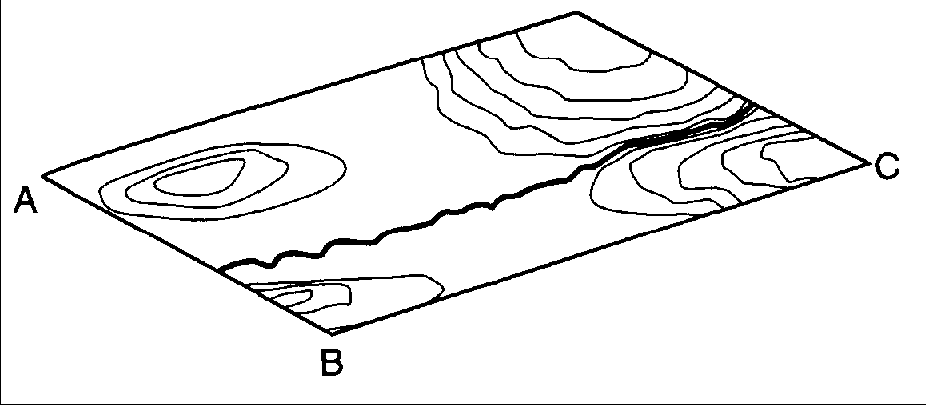
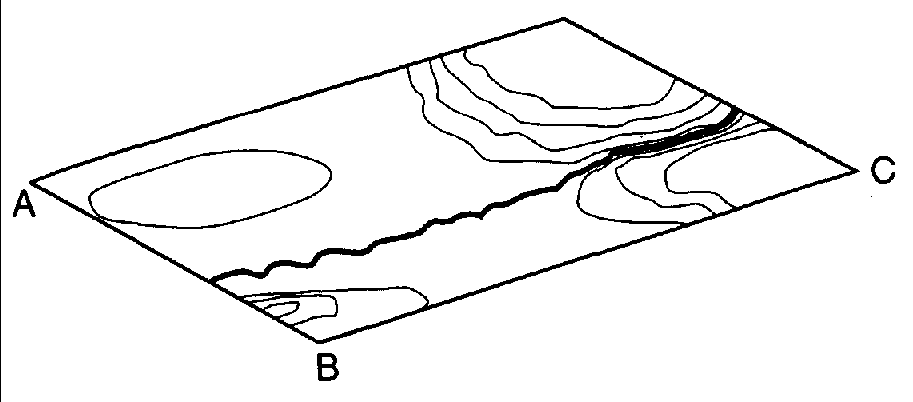
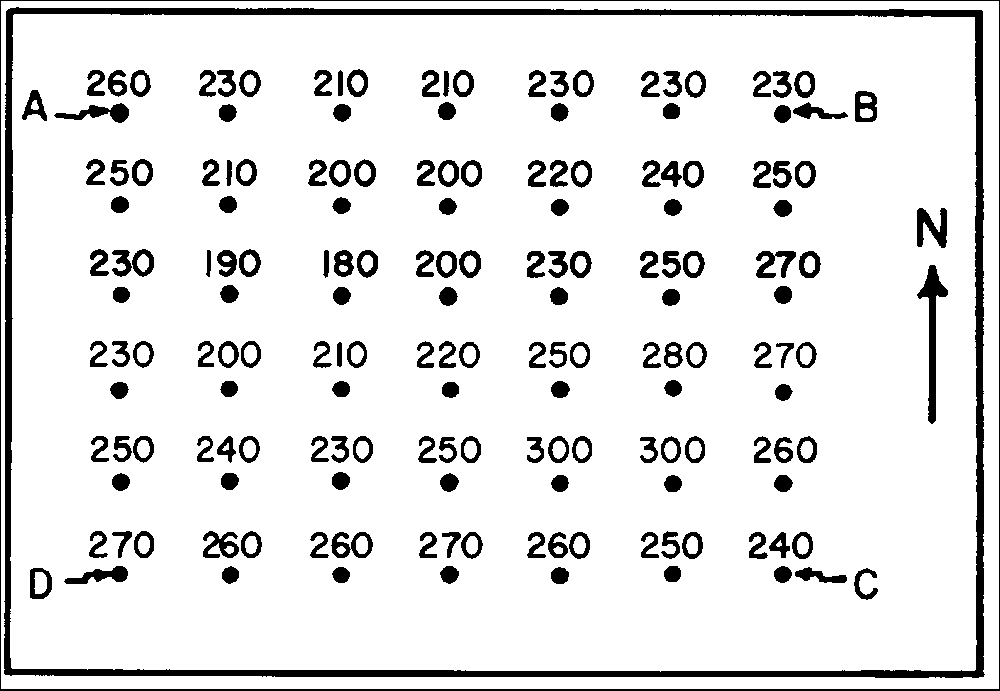
Use the map below to answer questions 37 through 49. Letters A, B, C, D, E, F, and G are locations on the map.

Which point is directly north of location D?
A
B
F
G
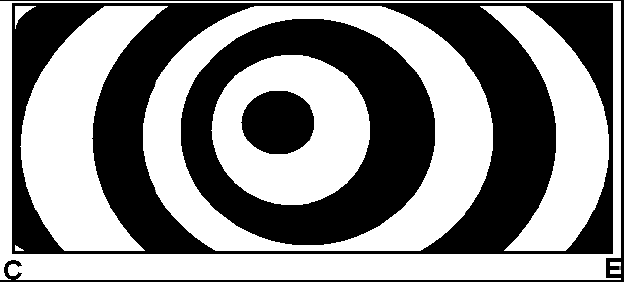
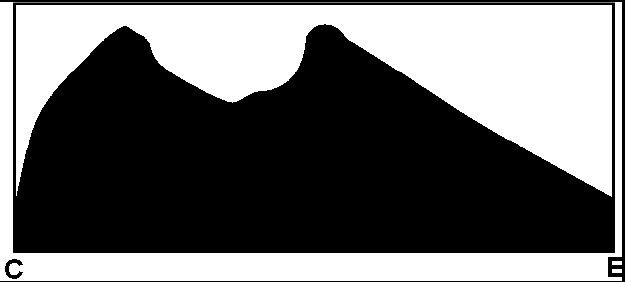
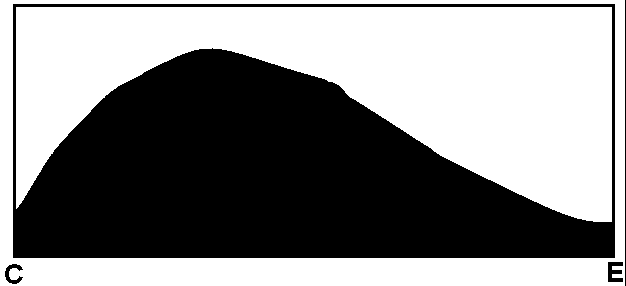
Which picture best matches the profile from point C to point E?

Which side of this landscape has the steepest side?
The East
The South
The West
The North
What is the lowest possible elevation of location D?
2,074 meters
2,050 meters
2,051 meters
2,075 meters
What is the gradient between locations A and E?
9.5 m/km
3.6 m/km
1.7 m/km
9.5 km
What is the highest possible elevation of location F?
2,124 meters
2,101 meters
2,125 meters
2,100 meters
What is the elevation of location G?
2,000 meters
2,075 meters
2,125 meters
2,100 meters
What is the highest possible elevation of location D?
2,050 meters
2,075 meters
2,074 meters
2,051 meters
What is the lowest possible elevation for location F?
2,101 meters
2,100 meters
2,124 meters
2,125 meters
What is the contour interval for this map?
33 meters
20 meters
100 meters
25 meters
The contour map above is likely to be a map of all of the following choices
except for one. Which one can NOT be the land feature that this map
represents?
A volcano
A mountain
A meteor crater
A sink hole
Which point has exactly the same elevation as location E?
A
B
C
D
What is the distance between locations A and C?
9.5 kilometers
4.5 kilometers
8.0 kilometers
6.7 kilometers
Which of the following is an example of a contour map that contains depression contour lines?
yes buttons