
Review for the 2008 - 2009 School Year Mid-term
Instructions:
Click here for the worksheet that goes with this! This worksheet is to provide you with a way to do the tasks that need drawing, and, therefore, cannot be completed using this webpage alone.
To reveal the answer to the questions, left click, hold, and drag over the area between the brackets. Practice: [Good! See how it works?]
However, it is recommended to actually try the questions first. Memorizing the answers will not help on your mid-term! You must know how to get the answers to these questions. They are similar to those that could be asked about on your mid-term.
![]()
Base your answers to questions 1 and 2 on the field map provided below. The field map below shows the temperature at specific locations in part of a local field. Two reference points, A and B, are shown.
1. Calculate the temperature gradient along a straight line between point A and point B on the map by following the directions below.
a Write the equation for determining the temperature gradient. [Gradient = (difference in field value)/(distance)]
b Substitute the correct values into the equation. [(27°C-24°C)/3.0 Meters]
c Solve the equation and record your answer in decimal form. Label the answer with the correct units. [1°C/M]
2. On the field map above, draw all isotherms with an interval of 5 and starting at 20ºC. Be sure that any isotherms that run off the page touch the box. [Check on separate answer key.]
![]()
Base your answers to questions 3 and 4 on the field map provided below. The field map shows air temperature at specific locations in an area near a school in New York State. Part of this area is a blacktop parking lot. Accurate temperature readings were taken by Earth science students at 10 a.m. on June 1. Two reference points, A and B, are shown.
3. Calculate the temperature gradient along a straight line between point A and point B on the map by following the directions below.
a Write the equation for determining the temperature gradient. [Gradient = (difference in field value)/(distance)]
b Substitute the correct values into the equation. [(17°C-15°C)/50 Meters]
c Solve the equation and record your answer in decimal form. Label the answer with the correct units. [0.04°C/M]
4. On the field map above, draw all isotherms with an interval of 5 and starting at 10ºC. Be sure that any isotherms that run off the page touch the box. [Check on separate answer key.]
![]()
Base your answers to questions 5 and 6 on the field map provided below. The field map shows air temperature at specific locations in an area near a school in New York State. Part of this area is a blacktop parking lot. Accurate temperature readings were taken by Earth science students at 10 a.m. on June 1. Two reference points, A and B, are shown.
5. Calculate the temperature gradient along a straight line between point A and point B on the map by following the directions below.
a Write the equation for determining the temperature gradient. [Gradient = (difference in field value)/(distance)]
b Substitute the correct values into the equation. [(22°C-19°C)/6.0 Meters]
c Solve the equation and record your answer in decimal form. Label the answer with the correct units. [0.5°C/M]
6. On the field map above, draw all isotherms with an interval of 1 and starting at 17ºC. Be sure that any isotherms that run off the page touch the box. [Check on separate answer key.]
![]()
Base your answers to questions 7 and 8 on the rock cycle diagram below.
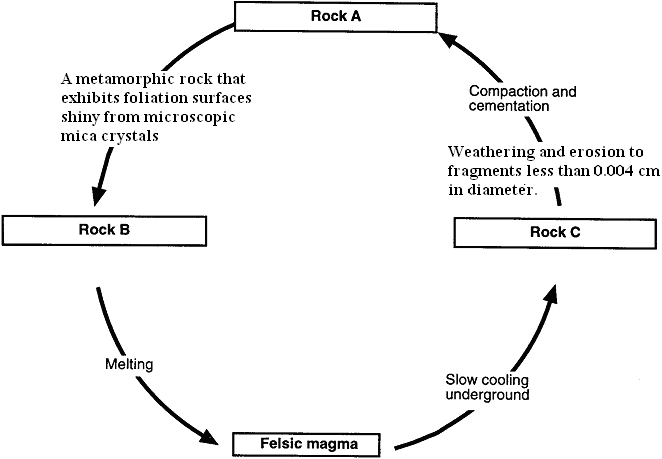
7. State the specific names of rocks A, B, and C in the diagram. Do not write the terms "sedimentary," "igneous," and "metamorphic."
A [Siltstone ]
B [Phyllite ]
C [Granite or Pegmatite ]
8. State one condition or process that would cause the metamorphism of rock A. [Partial melting; Recrystallization; Pressure from the collision of tectonic plates; etc.]
![]()
Base your answers to questions 9 through 11 on the diagram below. The diagram represents the supercontinent Pangaea, which began to break up approximately 220 million years ago.
9. State the compass direction toward which North America has moved since Pangaea began to break apart. [Northwest]
10. During which geologic period within the Mesozoic Era did the supercontinent Pangaea begin to break apart? [Cretaceous ]
11. State one form of evidence that supports the inference that Pangaea existed. [Matching of the rock strata and/or formations at different locations; Matching of index fossils; Look like puzzle pieces that fit together.]
![]()
Base your answers to questions 12 through 17 on the map below, which shows a portion of southwestern United States. On January 17, 1994, an earthquake occurred with an epicenter at Northridge, California.
12. State the latitude and longitude of Northridge, California. Include the correct units and compass directions in your answer.
Latitude [34° North]
Longitude [118.5° West or 118 1/2° West]
13. Explain why earthquakes are common in this region of California. [They form along the transform fault. They form where the two sides of a transform fault rub together.]
14. Of the cities shown on the map, explain why Oakland was the last city to receive P-waves from this earthquake. [It was the city that is furthest away from the epicenter and it takes time for the seismic waves to travel.]
15. List two actions that a homeowner could take to prepare the home or family for the next earthquake. [Any two logical answers.]
16. A seismic station in Oswego, New York, recorded the arrival of the first P-wave at 1:30:00 (1 hour, 30 minutes, 00 seconds) and the first S-wave from the same earthquake at 1:34:30.
a Determine the distance, in kilometers, from Oswego to the epicenter of this earthquake. [3,000 km ±100 km]
b How long did it take for the P-wave to arrive at Oswego? [5 min, 40 sec ±10 sec]
c What was the origin time of this earthquake? [1:24:20 ]
17. A seismic station in Massena, New York, recorded the arrival of the first P-wave at 2:59:30 and the first S-wave from the same earthquake at 3:09:00.
a Determine the distance, in kilometers, from Massena to the epicenter of this earthquake. [8,200 km ±100 km]
b State what additional information is needed to determine the location of the epicenter of this earthquake. []
![]()
Use the following information to answer questions 18 through 20.
Location A and Location B are in a straight line from the epicenter of an earthquake. Each location had a seismic station that recorded information from the same earthquake. Location A received their first P-waves at 11:59:00 p.m. and their S-waves at 12:02:20 p.m. Location B received their first P-waves at 12:04:00 and the S-waves arrived at 12:11:10 p.m.
18. Which location is the furthest away from the epicenter? [Location B]
19. How far apart are the two stations? [3,600 km ±100 km]
20. What was the origin time of this earthquake? [11:55:00 p.m. ±10 sec]
![]()
Base your answers to questions 21 through 28 on the topographic map of Cottonwood, Colorado, below. Points A, B, X, and Y are marked for reference.

21. State the general direction in which Cottonwood Creek is flowing. [Northeast]
22. State the contour interval shown on the map of Cottonwood, Colorado. [20 meters]
23. State the highest possible elevation, to the nearest tenth of a meter, for point B on the topographic map. [599.9 meters]
24. State the lowest possible elevation, to the nearest tenth of a meter, for point B on the topographic map. [580.1 meters]
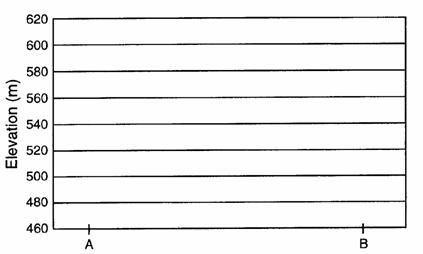
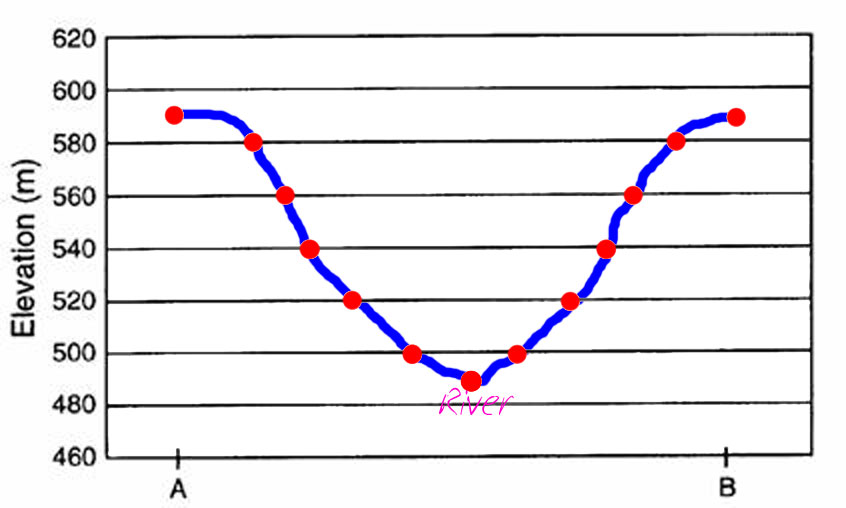
25. On the grid provided, draw a profile of the topography along line AB shown on the map. [Check on separate answer key.]
26. In the space provided, calculate the gradient of the slope between points X and Y on the topographic map, following the directions below.
a Write the equation for gradient. [Gradient = (difference in field value)/(distance)]
b Substitute data from the map into the equation. [(580 Meters - 480 Meters)/2.0 Kilometers]
c Calculate the gradient and label it with the proper units. [50 m/km]
27. How do you know which way Cottonwood Creek is flowing? [Law of the "V's" or decreasing numbers on the isolines.]
28. What is the distance between points A and B? (Include the units.) [2.5 kilometers]
![]()
Base your answers to questions 29 through 37 on the topographic map of Rush Creek, below. Points A, B, C, D, E, F, X, and Y are marked for reference.
29. State the general direction in which Rush Creek is flowing between points A and B. [Northeast]
30. How do you know which way Rush Creek is flowing between points A and B? [Law of the "V's" or decreasing numbers on the isolines.]
31. State the general direction in which Rush Creek is flowing between points C and D. [North ]
32. How do you know which way Rush Creek is flowing between points C and D? [Law of the "V's" or decreasing numbers on the isolines.]
33. State the contour interval shown on the map of Rush Creek. [100 feet]
34. State the highest possible elevation, to the nearest hundredth of a meter, for point F on the topographic map. [4,999.99 feet]
35. State the lowest possible elevation, to the nearest hundredth of a meter, for point F on the topographic map. [4,000.01 feet]
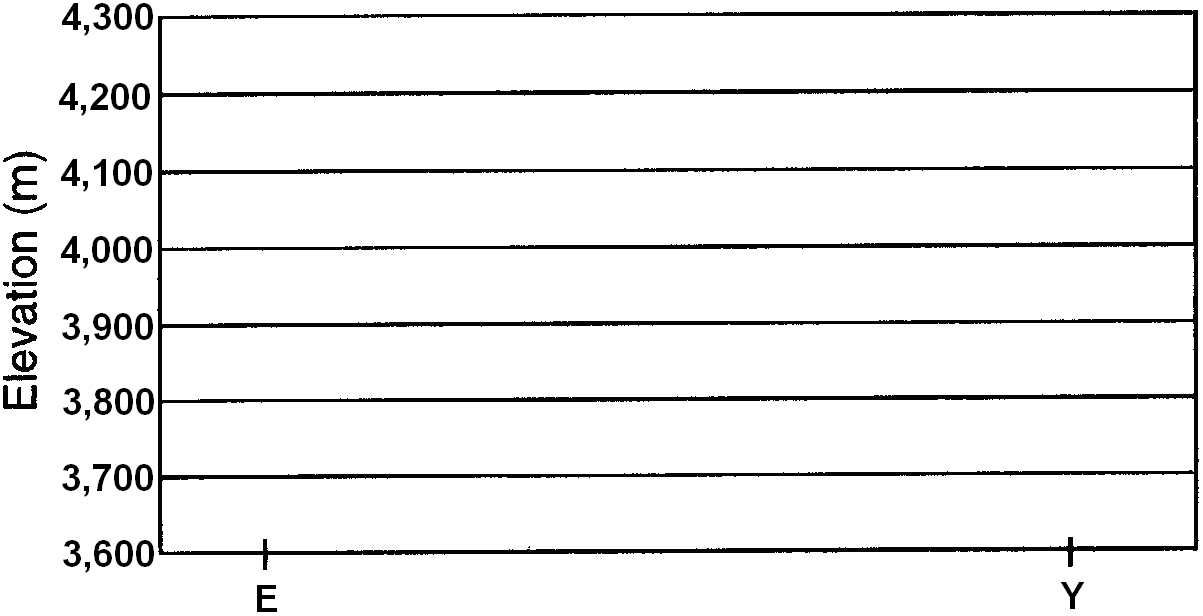
36. On the grid provided, draw a profile of the topography along line EY shown on the map. [Check on separate answer key.]
37. In the space provided, calculate the gradient of the slope between points A and Y on the topographic map, following the directions below.
a Write the equation for gradient. [Gradient = (difference in field value)/(distance)]
b Substitute data from the map into the equation. [(4,200 feet - 4,000 feet)/11.3 Miles]
c Calculate the gradient and label it with the proper units. [17.7 ft/mi]
![]()
38. A family wants to use rock materials as flooring in the entrance of their new house. They have narrowed their choice to granite or marble. Which of these rocks is more resistant to the physical wear of foot traffic and explain why this rock is more resistant.
Which rock: [Granite ]
Why: [Granite is made up of Potassium feldspar (has a hardness of 6), Quartz(7), Plagioclase feldspar (6), Biotite mica (2.5 to 3), and Amphibole (5.5), whereas, marble is composed of Limestone [which is made up of Calcite (3)] and Dolostone [which is made up of Dolomite (3.5)]. Therefore, since the majority of the minerals in Granite are harder than the minerals that make up Marble, Granite is more resistant to physical weathering. - Don't forget, hardness is defined as the ability to scratch or be scratched by another solid substance, and, therefore, the harder the materials, the less likely it is to get scratched.]
![]()
Answers to the above questions that were not answered in the brackets.
2. [Click here to go back to this question.]
![]()
4. [Click here to go back to this question.]
![]()
6. [Click here to go back to this question.]
![]()
25. [Click here to go back to this question.]
![]()
36. [Click here to go back to this question.]